
Funpack5-3 - Real-Time Audio Spectrum Analyzer Based on the MAX32690 EV Kit
Hi everyone, I'm 代码小A
I'm very honored to take part in the Funpack S5 #3 activity hosted by EETree (电子森林)
1. Project Introduction
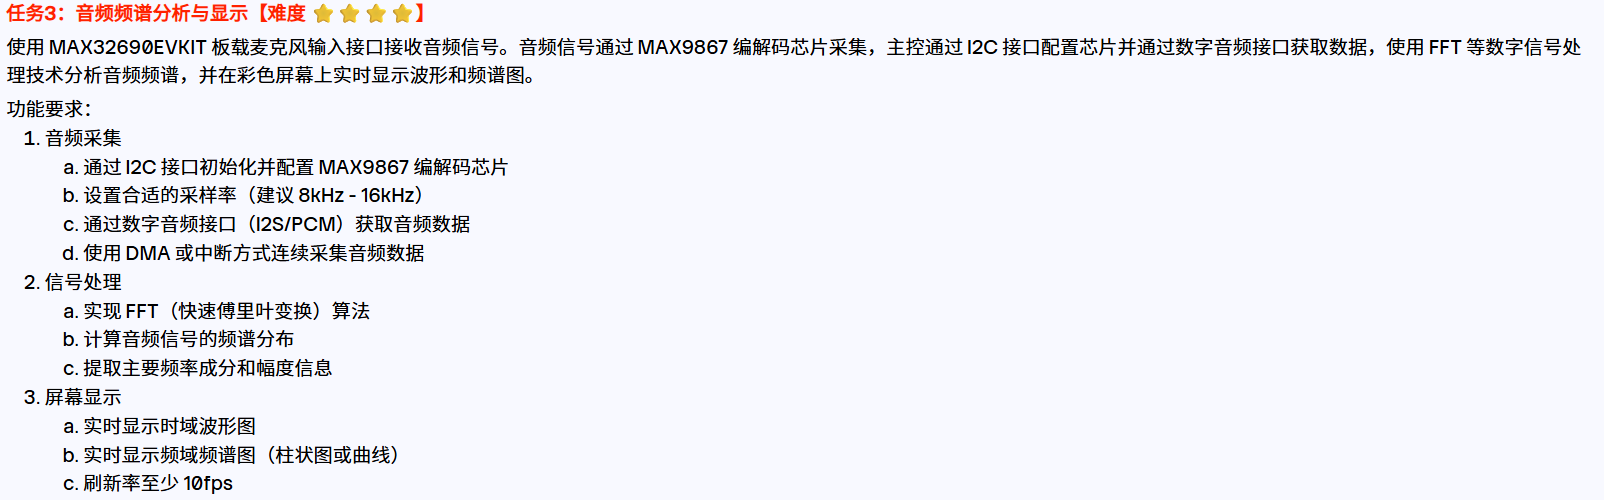
This project uses the MAX32690EVKIT development board to build a real-time audio spectrum analyzer: the onboard MAX9867 audio codec is configured over I2C and captures the audio signal from the Line-In input at a 16kHz sample rate; the main controller captures continuously without blocking via the I2S slave interface together with DMA double buffering; the captured data is processed by a self-written 512-point FFT (with a Hanning window) and then displayed in real time on the onboard 128×128 ST7735 color screen as a time-domain waveform and a frequency-domain spectrum, with the dominant frequency component extracted and shown in the screen's title bar. Frame rate, main frequency peak, and input level are also output over the serial port to make debugging and verification easy.
Completion status — the project fully meets the task requirements:
- Audio capture: I2C initialization and MAX9867 configuration; 16kHz sample rate (the task suggests 8~16kHz); I2S digital audio interface; continuous capture using DMA ping-pong.
- Signal processing: self-implemented radix-2 fast Fourier transform; spectrum distribution computation; extraction of the dominant frequency peak and amplitude information.
- Screen display: real-time display of the time-domain waveform (single-cycle triggered, 48 points) and the frequency-domain spectrum (96 bars); measured refresh rate of about 30fps, far exceeding the 10fps requirement.
2. Hardware Introduction
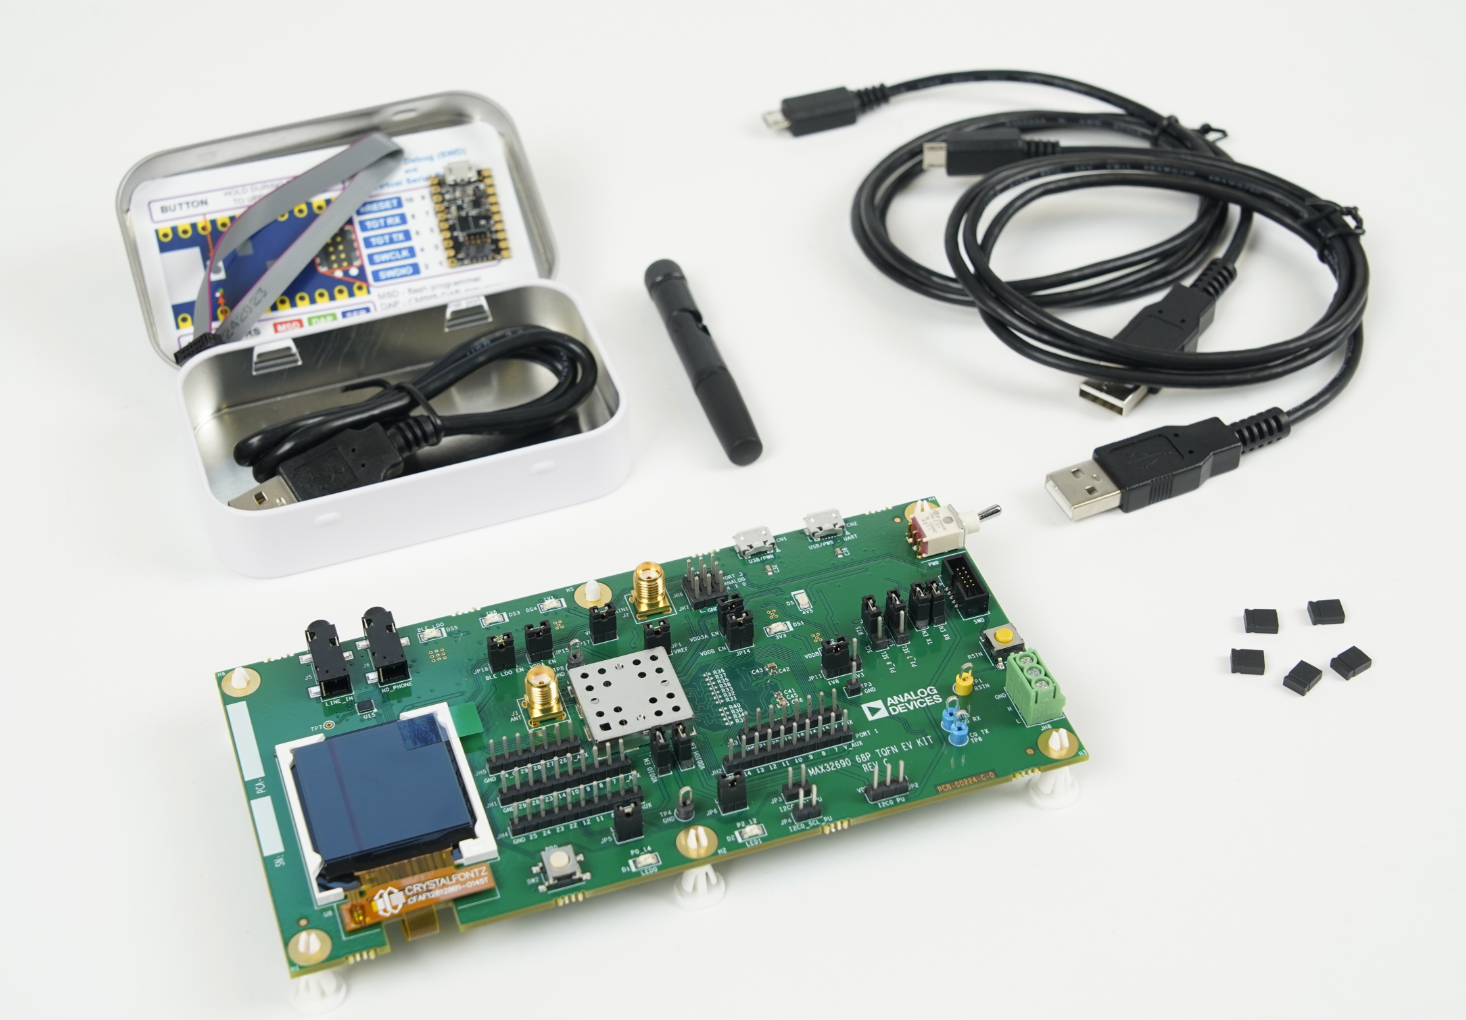
- MAX32690EVKIT main board: carries a MAX32690 microcontroller (ARM Cortex-M4F core, up to 100MHz, 3MB Flash and 1MB SRAM), with an on-chip DMA controller and rich peripherals including I2S, I2C, SPI, and UART, plus an onboard CMSIS-DAP debugger and a 128×128 TFT color display.
- MAX9867 audio codec: a low-power stereo codec supporting I2C register configuration (7-bit address 0x18), with internal ADC/DAC performing the analog-to-digital conversion; in this project it is configured as an I2S master, generating the 16kHz LRCLK and bit clock from a 12.288MHz MCLK via NI division, serving as the source of the audio data and clocks.
- ST7735S 128×128 TFT display: an SPI color screen, driven on the board by bit-banging SPI timing through GPIO.
- Test signal source: the audio output of a phone or computer is fed into the board's Line-In jack via an audio cable; together with a self-written web signal generator (Web Audio API) it can output test signals such as sine waves at arbitrary frequencies, frequency sweeps, and noise.
3. Block Diagram and Project Design Approach
The system block diagram is as follows:
The design approach mainly comes down to the following points:
- Decoupled data path: I2S + DMA only hand off buffer pointers inside the interrupt, while the main loop handles the FFT and display, ensuring no samples are lost during capture; the DMA ping-pong double buffer plus a 32-level ISR queue provides a safety net even when display work takes long.
- In-house FFT, zero dependencies: the 512-point radix-2 decimation-in-time FFT is implemented from scratch, using the M4 hardware FPU (VFP instructions can still execute under the soft-float ABI). It doesn't depend on the CMSIS-DSP library and doesn't require switching to a hard-float library, avoiding any changes to the SDK build chain.
- Display performance first: a 128×128 RAM frame buffer is used, rendering the whole strip first and then pushing it in batches; at the same time, borrowing the idea of "partial refresh" from a reference project, dirty columns are tracked per column and only changed columns are merged into rectangles and pushed to the screen, which sharply cuts SPI traffic when the signal is stable.
- Testability by design: the firmware has a built-in self-test mode (generating a 1kHz sine signal inside the board that runs through the full FFT/drawing pipeline), and it dumps the screen's spectrum coordinates over the serial port (ypts + ASCII plot), so drawing correctness can be verified remotely without an oscilloscope or logic analyzer.
4. Debugging Software, Software Flowchart, and Key Code Walkthrough
Debugging Software
- MSDK (Analog Devices MAXIM SDK): the official embedded development kit, providing peripheral drivers, BSP, and build system, using the bundled GCC 10.3 toolchain.
- VSCode + OpenOCD + CMSIS-DAP: writing code, compiling, flashing, and on-target debugging.
- Serial terminal: 115200-8-N-1, for viewing runtime logs and the spectrum dump.
- Self-written web signal generator (test-tone.html): based on the Web Audio API, it can output test signals such as sine/square/sweep/white noise, with frequency and volume sliders taking effect in real time, serving as the excitation source for the spectrum analyzer.
Software Flowchart
Key Code Walkthrough
1) 24-bit I2S data decoding (a gotcha)
The MAX32690's I2S stores 24-bit samples left-aligned in the upper 24 bits of a 32-bit word; you can confirm this from the driver source, where MXC_I2S_RevA_ConfigData performs (sample & 0xFFFFFF) << 8 before writing to the FIFO. The correct decoding is therefore an arithmetic right shift by 8:
int32_t l = (int32_t)buf[i] >> 8;
int32_t r = (int32_t)buf[i + 1] >> 8;
Previously I mistakenly used (buf << 8) >> 8, which decoded the real audio into low-bit noise — this was one of the root causes of the "abnormal spectrum drawing".
2) Self-written 512-point FFT (radix-2 decimation in time)
Bit-reversal permutation plus butterfly operations, with a precomputed twiddle-factor table; the full implementation is below:
static void fft_run(float *re, float *im)
{
    uint32_t i, j;
    uint32_t len;

    /* Bit-reversal permutation */
    for (i = 1, j = 0; i < AV_FFT_LEN; i++) {
        uint32_t bit = AV_FFT_LEN >> 1;
        for (; j & bit; bit >>= 1) {
            j ^= bit;
        }
        j ^= bit;
        if (i < j) {
            float tr = re[i]; re[i] = re[j]; re[j] = tr;
            float ti = im[i]; im[i] = im[j]; im[j] = ti;
        }
    }

    /* Butterfly operations */
    for (len = 2; len <= AV_FFT_LEN; len <<= 1) {
        uint32_t half = len >> 1;
        uint32_t step = AV_FFT_LEN / len;

        for (i = 0; i < AV_FFT_LEN; i += len) {
            for (j = 0; j < half; j++) {
                uint32_t p = i + j;
                uint32_t q = p + half;
                uint32_t t = j * step;
                float xr = re[q] * tw_re[t] - im[q] * tw_im[t];
                float xi = re[q] * tw_im[t] + im[q] * tw_re[t];

                re[q] = re[p] - xr;
                im[q] = im[p] - xi;
                re[p] += xr;
                im[p] += xi;
            }
        }
    }
}
Compared numerically against a naive DFT, a 1kHz sine lands exactly on bin 32, verifying the algorithm's correctness.
3) Single-cycle triggered waveform display
If the 48 points span the whole frame (512 points = 32 periods of 1kHz), each period gets only 1.5 points and shows up as "scattered dots". The fix: compute the period length from the dominant frequency, find a rising zero crossing to use as the trigger start, place all 48 points within a single period, and apply linear interpolation to get a smooth single-cycle sine:
uint32_t period = AV_FFT_LEN / track_bin;  /* Samples per period at the dominant frequency */
uint32_t trig = start;
int found = 0;

if (period < 16)  period = 16;   /* Relax to at least 16 samples at high frequencies */
if (period > 400) period = 400;

/* Look for a rising zero crossing within the last two periods as the trigger point */
for (k = 1; k < 2 * period; k++) {
    uint32_t ic = (start - k) & AV_RING_MASK;
    uint32_t ip = (start - k - 1) & AV_RING_MASK;
    if (ring[ip] <= 0.0f && ring[ic] > 0.0f) {
        trig = start - k;
        found = 1;
        break;
    }
}
if (!found) trig = start - period;

/* Take 48 evenly spaced points over one period, with linear interpolation */
for (i = 0; i < AV_WAVEFORM_POINTS; i++) {
    float pos = (float)trig +
                (float)i * ((float)period / (AV_WAVEFORM_POINTS - 1));
    uint32_t i0 = (uint32_t)pos & AV_RING_MASK;
    uint32_t i1 = (i0 + 1) & AV_RING_MASK;
    float frac = pos - (float)(uint32_t)pos;
    float v = ring[i0] * (1.0f - frac) + ring[i1] * frac;

    wave_smooth[i] = AV_WAVE_SMOOTH_ALPHA * wave_smooth[i] +
                     (1.0f - AV_WAVE_SMOOTH_ALPHA) * v;
}
4) Dirty-column partial refresh
After rendering each frame, the coordinates are compared against the previous frame; only columns that changed are sent to the screen, with consecutive changed columns merged into a single rectangle and written in batches. When more than 75% changed, it falls back to a full-strip refresh:
static void push_strip_partial(int y0, int h, const uint8_t *dirty)
{
    int x, count = 0;

    for (x = 0; x < AV_SCR_W; x++) {
        count += dirty[x];
    }
    if (count == 0) {
        return;  /* Nothing changed this frame, so send no SPI data at all */
    }
    if (count > AV_SCR_W * 3 / 4) {
        push_area(y0, h);  /* Push the whole strip when too much changed */
        return;
    }

    x = 0;
    while (x < AV_SCR_W) {
        while (x < AV_SCR_W && !dirty[x]) x++;
        if (x >= AV_SCR_W) break;
        int xs = x;
        while (x < AV_SCR_W && dirty[x]) x++;
        push_area_cols(y0, h, xs, x - 1);  /* Merge consecutive dirty columns into one rectangle */
    }
}
With a steady signal, the SPI data volume per frame drops from about 29KB to a few KB.
5) MAX9867 register-write delay patch
err = MXC_I2C_MasterTransaction(&i2c_req);
if (err) printf("I2C Write Error! Reg: 0x%02X, Code: %d\n", reg, err);
MXC_Delay(200);   // Wait for the codec to finish processing the previous command
return err;
Writing registers back to back to the MAX9867 requires internal processing time, which can pull SCL low (clock stretching), and MSDK's blocking I2C transactions have no timeout, so they'd wait forever; adding a 200µs delay after each write reliably avoids this.
5. Feature Gallery and Notes
The audio output of a computer or phone is fed into the EV Kit's Line-In via an audio cable, and a USB cable connects to the computer for power and CMSIS-DAP debugging.
Screen display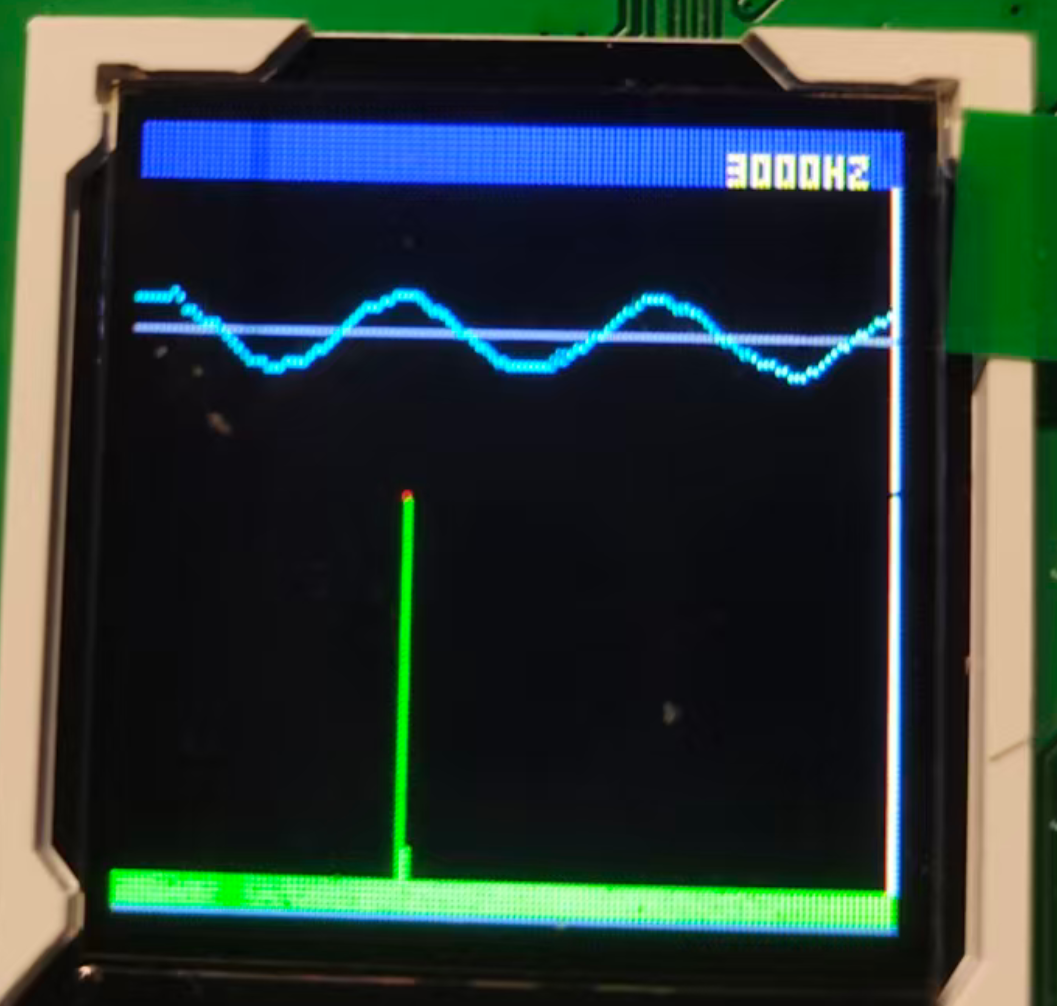
The upper part of the screen shows a cyan single-cycle waveform curve (automatic gain, with the sine wave full and clear), and the lower part shows a green spectrum bar chart (96 bars, linear frequency axis). The top-right corner of the title bar shows the dominant frequency (e.g. 3000Hz), with a red marker on top of the dominant-frequency bar.
Measured serial output (self-test mode, 1kHz sine generated onboard)
***** MAX32690 Audio Spectrum Analyzer *****
Sample rate: 16000 Hz, FFT: 512 points
Running...
TFT initialized successfully
Analyzing...
[Stats] FPS=31.2 Peak=1000Hz Lvl=-12dB
=== SPECTRUM DUMP ===
[DUMP] peak_hz=1000 scale_max=26.6 floor=13.4 sig_peak_db=-12.0 sig_rms_db=-15.0
[DUMP] ypts: 119 119 ... 8 7 28 ... 119
=== DUMP END ===
The ypts in the dump represent the vertical coordinate of each displayed point on the screen's spectrum polyline, and they match the theoretical values exactly (the position of the 1kHz main peak, the -6dB sidelobes ±1 bin away from the Hanning window), validating the entire chain of capture, FFT, normalization, and drawing.
Web signal generator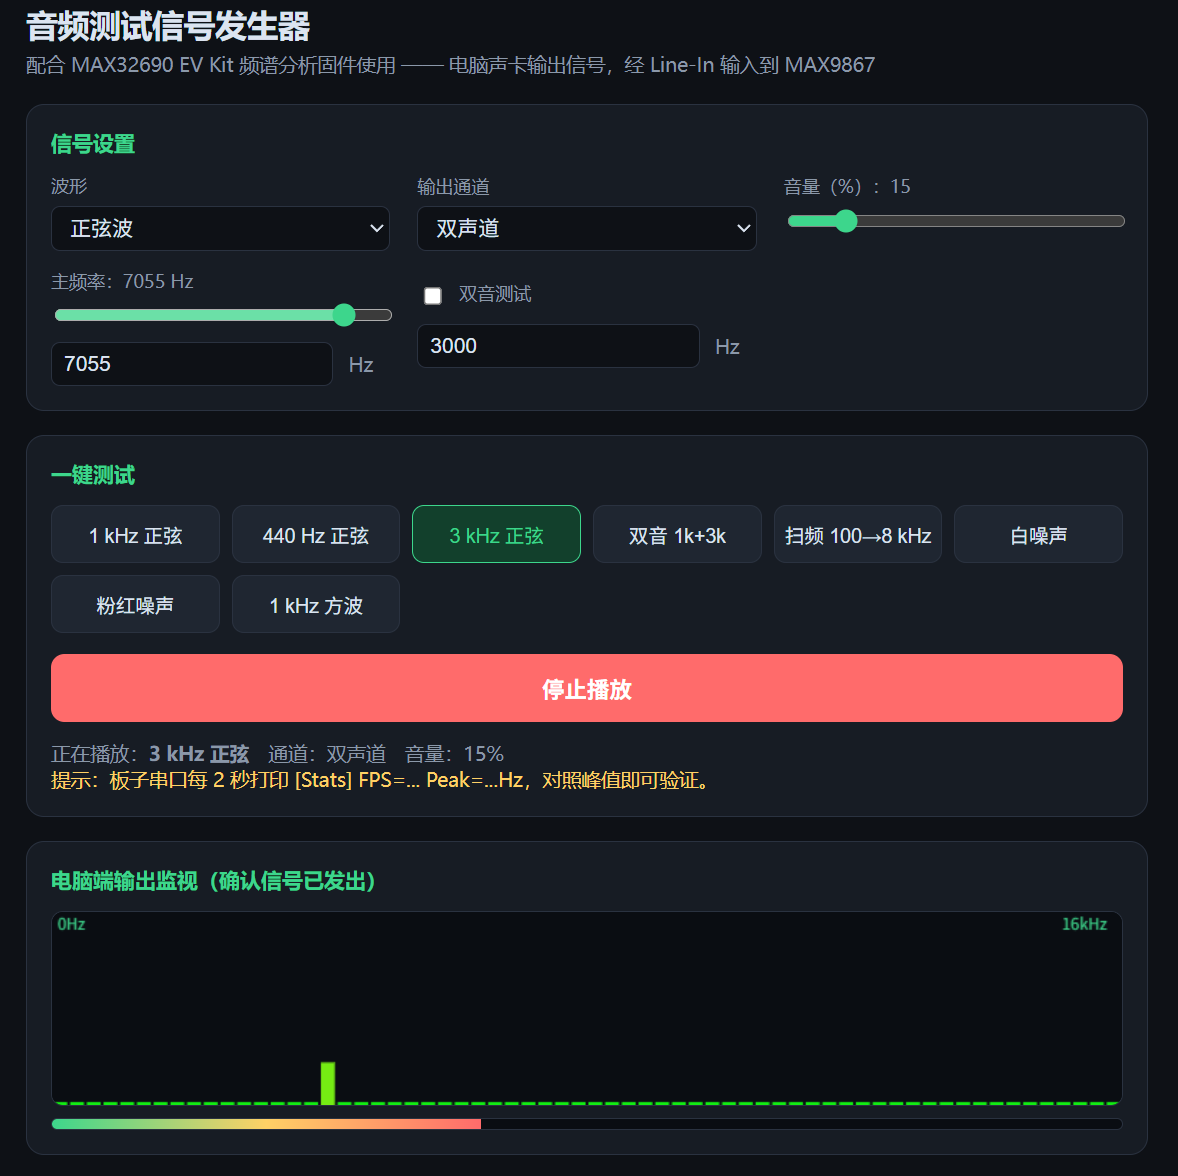
The self-written test page supports presets including 1kHz/440Hz/3kHz sine, dual-tone, frequency sweep, and white/pink noise, with the main frequency and volume sliders taking effect in real time; together with the board it lets you quickly verify the waveform period and spectrum position at different frequencies.
6. Problems Encountered in the Project and How I Solved Them
Problem 1: All spectrum bars were very high, and the 1kHz sine's peak jumped around between 1k/3k/5k/7kHz.
Two causes stacked up: first, a misunderstanding of the 24-bit I2S data alignment produced decoded noise; second, the input signal was clipping, flattening the 1kHz sine into an almost square wave and generating odd harmonics. Solution: fix the decoding to (int32_t)buf >> 8; lower the codec ADC gain (-12dB) and the web page's default volume; add a locking mechanism to peak detection (a candidate frequency must be more than 1.5× stronger than the currently locked frequency for 3 consecutive frames before switching).
Problem 2: The refresh rate was only 7.8fps and the screen stuttered.
The bottleneck was the GPIO bit-banged SPI: every byte went through two empty delay loops. Solution: override board.c within the project and remove the two delay loops (the ST7735's minimum write cycle is about 66ns; after removal each bit is still about 100ns, well within spec), speeding up the bit-banged SPI by roughly 3×; combined with full-strip frame buffer pushes, the measured FPS rose to 31.
Problem 3: How to verify that the screen drawing was correct without an oscilloscope.
I added a self-test mode and serial dump to the firmware: the board generates a sine signal at a known frequency, runs the full FFT and drawing pipeline, then outputs each displayed point's vertical coordinate and an ASCII sketch over the serial port. Comparing the dump against the theoretical calculations confirms the whole chain works, remotely.
7. Takeaways
This project gave me a systematic understanding of the complete audio chain "from capture to display": configuring the codec over I2C, I2S timing and data alignment, continuous DMA capture, FFT spectrum analysis, and small-screen display performance optimization — every link can become a bottleneck.
On the display optimization side, I practiced the trade-offs among several approaches: full frame-buffer refresh is simple and reliable but strains SPI bandwidth; the segmented partial refresh from the reference project is cleverer but its per-pixel window commands are actually slower; in the end I settled on "frame buffer rendering + dirty-column merged pushes", which balances simplicity and performance, measuring about 30fps. Performance optimization isn't about blindly piling on tricks, but about finding the real bottleneck (here, the delay loops in the bit-banged SPI).
Finally, putting test tools first also benefited me greatly: the self-test mode plus serial dump made the screen drawing results "quantifiable and comparable", and the web signal generator made the excitation signal controllable and repeatable. This approach not only solved the verification problem for this project, but is also worth carrying over to future embedded projects.
Changelog
0ca31-on